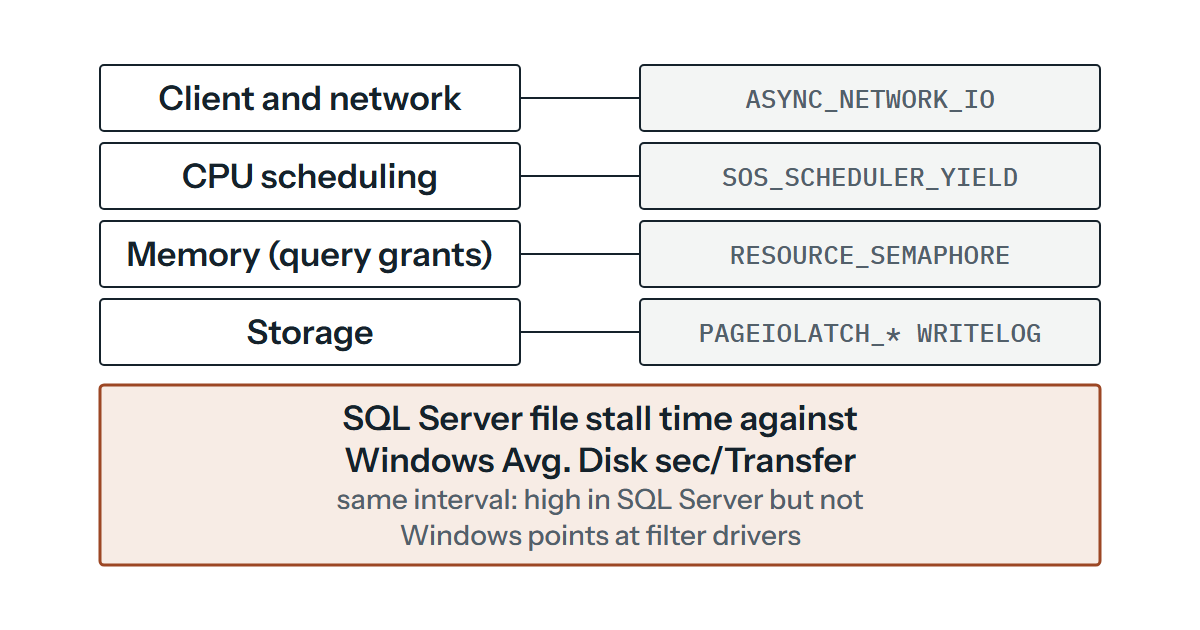
Picture a database that’s slow and three teams with green charts. The DBA looks at the plan and finds nothing wrong with it, the storage team looks at the array dashboard and finds nothing wrong with that, and the virtualisation team shows a host that’s mostly idle. Everybody’s chart is green and the application still takes eleven seconds to save an order. That stalemate can mean nobody has measured at the point where the layers meet, which is where SQL Server records what each of its threads spent its time waiting for.
This assumes SQL Server 2016 or later on Windows. Linux, Azure SQL Database and Managed Instance are left out. The DMVs need VIEW SERVER STATE (or VIEW SERVER PERFORMANCE STATE from SQL Server 2022), and sys.master_files also depends on which databases you’re allowed to see. The T-SQL below is all read-only and all illustration, so check each query against your own version before you run it on a live server.
Read waits as a rate, never as a total
sys.dm_os_wait_stats is where a lot of this starts, and it has a trap. Its statistics are cumulative since the last reset or the last startup of the database engine, so a server that’s been up for 90 days will show you three months of history, and a bad ten minutes this morning vanishes into it. The view also only shows waits that have completed. So you capture it twice with an interval between the two captures, then subtract.
-- Illustration: run twice, some minutes apart, and subtract the first result from the second.
SELECT i.ms_ticks, w.wait_type, w.waiting_tasks_count,
       w.wait_time_ms, w.signal_wait_time_ms
FROM sys.dm_os_wait_stats AS w
CROSS JOIN sys.dm_os_sys_info AS i
WHERE w.wait_type IN (N'PAGEIOLATCH_SH', N'PAGEIOLATCH_EX', N'WRITELOG',
                      N'ASYNC_NETWORK_IO', N'SOS_SCHEDULER_YIELD',
                      N'RESOURCE_SEMAPHORE', N'THREADPOOL')
ORDER BY w.wait_type;
Here’s how the arithmetic goes, with made-up numbers. Say PAGEIOLATCH_SH shows a task count of 41,200, a wait time of 1,030,000 ms and a signal wait of 9,000 ms on the first capture. Ten minutes later it shows 53,200, 1,330,000 and 10,500. The differences are 12,000 waits, 300,000 ms and 1,500 ms, so the average wait was 300,000 / 12,000 = 25 ms. Those waits also added up to 300 seconds in a 600-second interval, but that isn’t half the time or half the workload. Wait time is summed across every worker that waited, so with enough concurrent requests the total can exceed the interval itself, and it can’t tell you what fraction of your queries or users were affected. Use it for size and comparison instead: set it against the other wait types’ differences over the same ten minutes to see whether this one stands out. The per-wait average is the more telling figure here, because 25 ms is well above the 10 to 15 ms range Microsoft treats as a prompt to look at storage (more on that below).
One column needs care. wait_time_ms includes signal_wait_time_ms, which is the gap between a thread being signalled and it starting to run. A thread whose resource is ready doesn’t resume instantly; it joins the queue of runnable workers and waits for a turn on the scheduler. So a large signal share of a wait points at queuing for CPU rather than at the resource named in the wait type. In the example the signal part is 1,500 of 300,000 ms, which is 0.5 per cent, so CPU queuing isn’t the story here and the wait is mostly the I/O itself.
Storage: compare what SQL Server saw with what Windows saw
Microsoft documents PAGEIOLATCH_SH as a task waiting on a buffer that’s in an I/O request, with the shared mode used when the buffer is being read from disk, and says long waits might indicate problems with the disk subsystem. WRITELOG is a wait for a log flush to complete, and the page lists disk latency on the log files, I/O that can’t keep up with transactions and a large number of log operations and flushes as common reasons.
For a number to compare against, there’s Microsoft’s troubleshooting article on slow I/O. It says that if PAGEIOLATCH_*, WRITELOG and similar waits exceed 10 to 15 milliseconds consistently, I/O is considered a bottleneck, but it’s candid that the figure is “a very approximate threshold” chosen from collective experience, and that what a storage system should deliver depends on its make, configuration and workload. So treat 10 to 15 ms as a prompt to look harder, and let your own baseline tell you what normal is.
For per-file latency, sys.dm_io_virtual_file_stats gives cumulative read and write counts and stall times (the total time users waited for I/O on the file), reset when the service starts. Its sample_ms column is there so you can compare outputs, and the same twice-and-subtract approach applies. The query that follows lists every file, so you can see whether the pain is on the data files, the log file or tempdb.
-- Illustration: capture twice and subtract. Average read latency in the interval =
-- change in io_stall_read_ms / change in num_of_reads (likewise for writes).
SELECT vfs.sample_ms, DB_NAME(vfs.database_id) AS database_name, mf.physical_name,
       vfs.num_of_reads, vfs.io_stall_read_ms,
       vfs.num_of_writes, vfs.io_stall_write_ms
FROM sys.dm_io_virtual_file_stats(NULL, NULL) AS vfs
JOIN sys.master_files AS mf
  ON vfs.database_id = mf.database_id AND vfs.file_id = mf.file_id;
If one file’s average latency in the interval stands out from the rest, that’s where to start looking, though check what was running against it at the time. If every file is slow together, the shared path or volume is the likelier place to look, or the workload is simply more than it can carry.
Take the same interval to Windows. The Avg. Disk sec/Read, Avg. Disk sec/Write and Avg. Disk sec/Transfer Performance Monitor counters measure how long the I/O subsystem takes, on average, to service each request in clock time. Occasional spikes in the Windows counter don’t matter in most cases, but a spike that lasts a minute or more is a plateau. Comparing the two views shows which layer the delay is in, which is a good guide to who to talk to first.
- Both show high latency. The delay is probably beyond SQL Server’s own layer. Check the byte-rate counters (
Disk Bytes/secand the read and write versions on thePhysicalDiskobject) against the throughput the vendor or your storage owner gives for the path. - SQL Server shows latency but Windows doesn’t. The problem then sits between SQL Server and the Partition Manager, which means file-system filter drivers (anti-virus, backup, encryption or compression software).
fltmc instanceslists them. - Both are quiet. Storage is probably not the delay, so move on to the next layer.
If the disks are saturated, check whether SQL Server is the one driving the load. The Buffer Manager counters Page Reads/sec and Page Writes/sec show that. Heavy reads from the database can point back to indexes and queries, or to too little memory for the working set, and in that case the database team owns the fix after all. That’s the point of measuring first.
On layout, Microsoft’s I/O article recommends separate volumes for data and log files, on the grounds that log writes are sequential and data access is random. It also lists too many virtual log files and many small transactions as WRITELOG causes, and log writer scheduling too, though that’s rarely a cause from SQL Server 2019 onwards. Sort and hash spills to tempdb show up as IO_COMPLETION, so check tempdb storage as well.
CPU and scheduling: queueing is not the same as being busy
SOS_SCHEDULER_YIELD is documented as a task voluntarily yielding the scheduler and waiting in the runnable queue for its time on the CPU. Prolonged waits most frequently mean scan-heavy queries that need tuning, and if query times are acceptable the wait is expected and can be ignored. So it’s not an automatic sign of a starved host.
For a closer look, sys.dm_os_schedulers has one row per scheduler, each mapped to a processor.
-- Illustration: schedulers that run user queries have an ID below 1048576.
SELECT scheduler_id, cpu_id, runnable_tasks_count, current_tasks_count,
       work_queue_count, total_cpu_usage_ms, total_scheduler_delay_ms
FROM sys.dm_os_schedulers
WHERE scheduler_id < 1048576;
Long runnable queues on most schedulers, sustained over several samples, tell you queries are queuing for CPU time. That’s a finding about contention, though, not about its cause, which could be the queries themselves, other processes on the guest or something on the host.
runnable_tasks_count is a point-in-time count of workers waiting on the runnable queue. Two columns from SQL Server 2016 are worth sampling: total_cpu_usage_ms is CPU consumed by the scheduler as reported by non-preemptive workers, and total_scheduler_delay_ms is the time between one worker switching out and another switching in. The page doesn’t say they accumulate, but the names suggest it, so sample twice and compare. That delay can come from preemptive workers holding up the next worker, or from the operating system scheduling threads from other processes.
That last phrase deserves a caution. The page doesn’t mention virtual machines, so don’t assume the column captures CPU a hypervisor has taken away. The instance can report whether it believes it’s virtualised: sys.dm_os_sys_info gives virtual_machine_type_desc as HYPERVISOR for a virtual machine on a host with hardware-assisted virtualisation, OTHER for one without, and NONE when it isn’t in a virtual machine, along with cpu_count, the logical CPU count it can see. If runnable queues are long, query times are poor and the guest looks no busier than usual, the evidence that settles it lives on the host, in whatever the platform exposes for CPU scheduling delay. SQL Server’s own views don’t show that, so the platform owner has to supply it.
One related point: Microsoft’s compute capacity article says that where per-virtual-processor performance matters you might disable simultaneous multithreading, and consider separating virtualised workloads from ones that gain from it.
Worker threads are the other CPU-side limit. THREADPOOL is a task waiting for a worker thread. The max worker threads setting may be misconfigured, but the more common cause is batches running unusually long, which leaves fewer workers free. It’s a symptom to trace back to the long batches.
Memory: a configured limit, and a host that can take it back
max server memory caps the buffer pool, and Microsoft recommends setting an upper limit in all versions. The table on its page gives 75 per cent of available system memory not used by other processes as the recommendation, and warns that too low a value is a lost performance opportunity that can cause memory pressure. Because it limits only the buffer pool, other allocations sit outside it, which is why the leftover has to be sized for the operating system and everything else on the machine.
On a virtual machine there’s a second question: whether the host is overcommitting memory, so that it may later take some back from the guest. Microsoft’s memory troubleshooting article says to ensure the VM’s memory isn’t overcommitted. The max server memory page goes further and says a min server memory value is necessary in a virtualised environment, so that memory pressure from the host doesn’t deallocate buffer pool memory beyond what’s needed for acceptable performance. It also notes SQL Server isn’t guaranteed to take that amount if the load never needs it. A buffer pool the host is quietly shrinking would mean more physical reads, so PAGEIOLATCH_SH rises and it looks like a storage fault. Confirming that takes the host’s own memory figures, and as with CPU, they have to come from whoever runs the platform.
Memory also appears as RESOURCE_SEMAPHORE, a query memory request that can’t be granted immediately because of other concurrent queries. That’s workspace memory for sorts and hashes, not the buffer pool. Microsoft’s memory grants article checks by listing the requests not yet granted, using sys.dm_exec_query_memory_grants.
-- Illustration, adapted from Microsoft's memory-grant troubleshooting article: queries still waiting for a grant.
SELECT session_id, request_time, requested_memory_kb, required_memory_kb, wait_time_ms
FROM sys.dm_exec_query_memory_grants
WHERE grant_time IS NULL;
Rows here mean queries are queued for workspace memory right now, and a long wait_time_ms shows how long they’ve waited so far. The view is a snapshot and grant queues can come and go within seconds, so run it a few times during a slow spell before you cross RESOURCE_SEMAPHORE off.
High waits might indicate too many concurrent queries or excessive memory requests, which are workload questions for the database team before they’re capacity questions for anyone else.
Network: check the client before the cable
ASYNC_NETWORK_IO sounds like a network wait and, going by the Microsoft wording, it’s closer to a client problem. It occurs on network writes when the task is blocked waiting for the client application to acknowledge it has processed all the data sent. Microsoft’s advice is to verify that the client is processing data as fast as possible and that no network delays exist, and it lists the client reasons first: writing results to a file as they arrive, waiting for user input, filtering a large result set on the client instead of the server, or a deliberate wait. A slow client computer, with low memory or 100 per cent CPU, also counts. Network causes come after that, namely adapter driver issues, filter drivers, firewalls or misconfigured routers.
So when this wait dominates, look at what the application does with its result set before you open a ticket with the network team. There’s no published latency target for this path that we’d lean on, so compare against your own baseline.
tempdb and file layout
PAGELATCH_UP on tempdb is a different animal from PAGEIOLATCH_*, because the buffer isn’t in an I/O request at all. It commonly appears when a system allocation page such as PFS, GAM or SGAM is latched, and Microsoft’s wait statistics page attributes page latch update waits to incorrect file layout. The tempdb article gives general guidance: as many data files as logical processors up to eight, then more in multiples of four only if allocation contention persists. All data files should share the same initial size and growth settings, because of proportional fill. Preallocate space, and use instant file initialisation where possible. Where spills are the problem, the tempdb volume is the one to measure.
A method you can repeat
Put together, here’s the order we’d work in. First, capture a baseline when nothing is wrong, covering waits, file stalls, scheduler figures and the operating system counters, for a normal day and a busy one. Second, when there’s a complaint, capture the same set over a defined interval and work with the differences. Third, line up the layers: which waits grew, what the per-file latency was, whether Windows agrees, whether runnable queues lengthened, whether the guest or the client looks different. Fourth, make one change and measure the same interval again, because two changes at once tell you nothing about either.
| What the deltas show | Likely first owner | What to ask for |
|---|---|---|
High PAGEIOLATCH_* or WRITELOG, and Windows disk latency agrees | Storage or virtual disk path | Throughput limits and queueing for that volume |
| SQL Server file latency high, Windows latency low | Whoever runs the filter drivers | fltmc instances output and exclusion settings |
High PAGEIOLATCH_SH with many Page Reads/sec | Database team first | Query and index review, memory sizing |
SOS_SCHEDULER_YIELD, long runnable queues, poor query times | Database team, then host owner | Plans, then host CPU scheduling figures |
RESOURCE_SEMAPHORE | Database team | Concurrent queries and grant sizes |
ASYNC_NETWORK_IO | Application owner | How the client consumes results |
The “likely first owner” column is our rule of thumb, not a Microsoft rule, and a real fault can sit in more than one row. Collecting baselines regularly is the sort of routine that could be part of the continuing support we arrange individually where agreed, though our data work is specialist consultancy rather than managed database administration.
A baseline is also what ends the argument between a database team and an infrastructure team, because it turns two opinions into one set of numbers. If you’d like a second pair of eyes on that evidence, or help collecting it alongside your own engineers, get in touch before anyone changes a setting.